A Process Twin, Not Just a Digital Twin: How DMI's Process Twin Works and Why It's Different
By Mark Davidson, CEO
"Digital twin" has become one of the most stretched terms in manufacturing. It can mean a photorealistic 3D model of a line, a physics simulation of a single pump, a CAD file linked to a maintenance record, or a dashboard with a picture of the plant behind it. Many of these are impressive. Few of them answer the question an engineer actually asks before touching a setpoint: if I change this, what happens to everything after it, and is now the right time to do it?
DMI's process twin was built to answer exactly that question. This article explains how it works and how it differs from the twins most manufacturers have seen.
What most digital twins are
Traditional digital twins tend to fall into three groups:
- Visual twins. A 3D replica of the plant or a machine, often linked to live tag values. Good for orientation and training, but the picture doesn't know that the bioreactor feeds the harvest step, or that the filler can't run faster than the capper.
- Physics and engineering twins. First-principles or CFD models of a specific asset. Accurate for the thing they model, but each one takes specialists, months of calibration and ongoing upkeep, and it usually covers one machine rather than the process around it.
- Cloud data twins. A copy of the plant's data in a cloud platform, modelled there and analysed there. Every question means moving data out of the plant and paying for it again.
All three model things. What they often miss is the process: the order of stages, which unit feeds which, where material transfers, and where one site ends and the next begins.
DMI's process twin starts with the process graph
DMI builds its twin from the structure your plant already has. It discovers the databases, tables and tags on each AnyLog edge node, organises them into a reviewed unified namespace (enterprise, site, area, cell and tag), identifies the type of process (DMI's catalogue covers 29, from biopharmaceutical and brewing to automotive, semiconductor, drilling and water treatment), and generates a single ISA-95 process graph.
That graph is the process twin. Its nodes are your real units and tags, bound to the tables that hold their readings. Its edges are process relationships such as feeds into, transfers to, controls, cascades to and precedes. It knows the order your process runs in and how material and control flow through it. And because a person reviews the namespace before the graph is generated, the twin describes the plant you actually have, not one a model imagined.
A picture of the plant shows where things are. A process graph shows what happens next.
How a simulation runs
On DMI's Simulation screen, you pick a unit (anything from a site down to a single tag), then name the parameter and the proposed new value. DMI then:
- Starts from the live reading. If you don't enter a starting value, DMI queries the current value from the edge node that holds it. The baseline is the process as it is right now, not a design value.
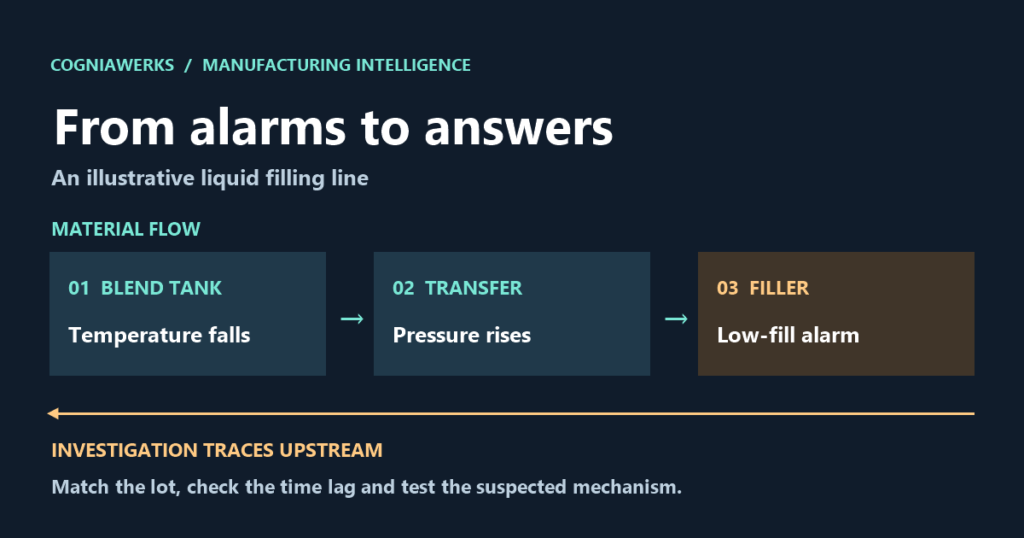
- Finds the process that owns the change and walks the graph forward to every downstream stage it reaches, and backward to the stages that feed it.
- Projects the effect on each affected process from the live readings of its rate, flow, count, output and quality tags. Stages closer to the change take more of the move and later stages are damped, so the projection reflects how a real process absorbs a disturbance.
- Returns a verdict: the change is local, the downstream impact needs review, or do not change now. A critical verdict is raised, for example, when an outlet or transfer path is open and an altered material or state would be sent straight into the next stage.
The result shows the current and simulated value of each affected metric, the change in each downstream process, and the graph relationships that connect them, so an engineer can see exactly why DMI reached its answer.
Six ways DMI's process twin is different
1. It models cause and effect, not just geometry
Because the twin is a process graph, the same structure powers root-cause analysis (walking upstream to find what moved first) and simulation (walking downstream to see what a change will reach). One model serves both questions: why did this happen? and what will happen if I do this?
2. It stays inside the site boundary
Many operations run parallel lines, rigs or sites with similar tag names. A naive model can mistake a sister line for a downstream effect. DMI's walks stay within the site the change belongs to, and an AI write-up that cites a unit outside that boundary is corrected. A parallel plant is never drafted in as a cause or an effect.
3. It knows when not to predict
DMI follows the quality principles of W. Edwards Deming and Walter Shewhart. A simulation is a prediction, and a prediction is only meaningful when the process is stable. If SPC shows a special cause, the process is still changing, and a simulated delta describes a process you don't have. That's why DMI's method puts Simulate after Observe, Investigate, Explain and Recommend: stabilise first, then predict. Most twins will simulate anything you ask; DMI is designed to tell you when to hold the change.
4. The graph decides; the AI only explains
DMI's edge language model writes a plain-language briefing of each simulation, but it can't change the numbers. It can't invent a delta, add a graph edge or soften a critical verdict: if the graph says do not change now, the briefing says so too. The process graph is the authority, and the AI is the narrator.
5. It runs inside the plant
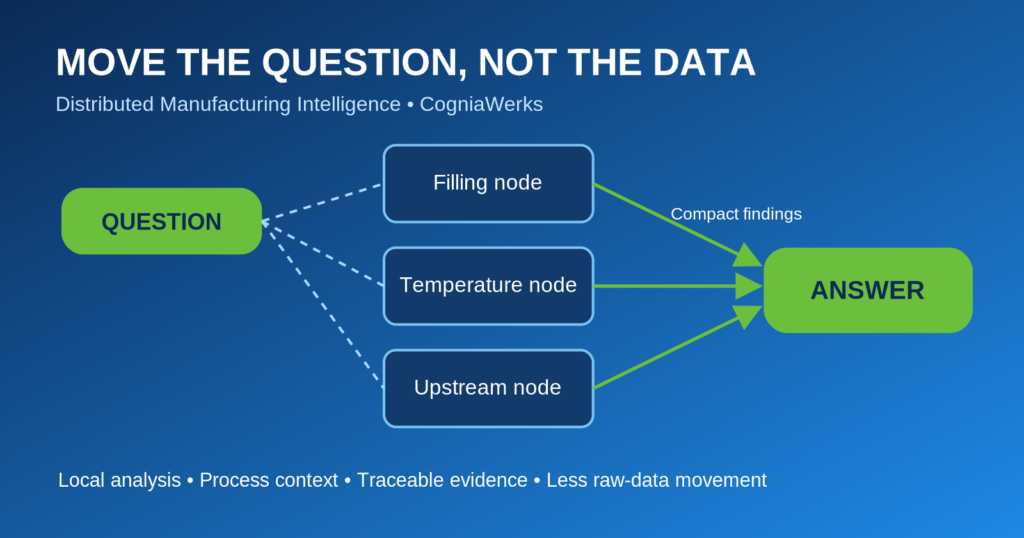
The twin, the live readings, the simulation and the language model all run next to the machines on the AnyLog edge data fabric. Process data doesn't have to leave the site, the twin keeps working without Internet access, and running a simulation a hundred times costs the same as running it once. There is no per-query cloud bill.
6. It's ready in days, not a modelling project
There's no CAD import, no physics calibration and no separate twin-building project. The twin is generated from the namespace and data you already have. If your process changes, you review the namespace and generate the graph again.
From simulation to action, and back
A twin is only valuable if it changes what happens on the floor. In DMI, the latest simulation is available as a finding when you raise a business process automation workflow. The team reviews the evidence and the simulated outcome, a person approves the change, and it runs as a DMI work order, a Microsoft Teams card or a Power Automate flow. Afterwards, DMI compares before-and-after readings to measure whether the change delivered, and records the result in the savings register. The prediction is checked against what actually happened.
Being clear about what it is
DMI's process twin is a process-level decision-support model, not a first-principles physics simulator. Its projections come from live readings, process relationships and transparent propagation rules, so engineers can see and question every step. If you have a CFD model of a heat exchanger, keep it. DMI complements those tools by answering the question they don't: what a change will do to the rest of the process, and whether this is the moment to make it.
See it on your process
Pick a line where setpoint changes have caused surprises downstream. Connect its data in place, let DMI build the process graph, and simulate the change before you make it. If you'd like to see it on a process like yours, request a demo.
See DMI on your process
Book a tailored walkthrough with our team.